Fig. 2. Overlap between data sets from palmitate-only and palmitate + fructose treatment groups. Venn diagrams were generated to show the overlap between the two treatment conditions for mRNAs and lncRNAs.
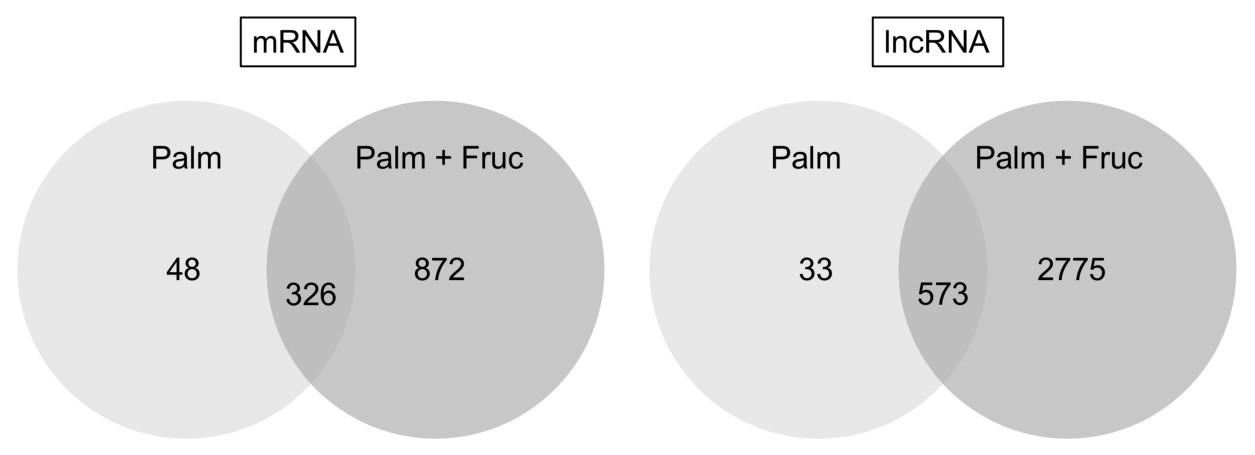
Fig. 2. Overlap between data sets from palmitate-only and palmitate + fructose treatment groups. Venn diagrams were generated to show the overlap between the two treatment conditions for mRNAs and lncRNAs.